3.5 KiB
GPU Documentation
Options
General
See the top of src/xenia/gpu/gpu.cc.
--vsync=false will attempt to render the game as fast as possible instead of
waiting for a fixed 60hz timer.
OpenGL
See the top of src/xenia/gpu/gl4/gl4_gpu.cc.
Buggy GL implementations can benefit from --thread_safe_gl.
Tools
Shaders
Shader Dumps
Adding --dump_shaders=path/ will write all translated shaders to the given
path with names based on input hash (so they'll be stable across runs).
Binaries containing the original microcode will be placed side-by-side with
the dumped output to make it easy to pipe to xe-gpu-shader-compiler.
xe-gpu-shader-compiler
A standalone shader compiler exists to allow for quick shader translation testing. You can pass a binary ucode shader in and get either disassembled ucode or translated source out. This is best used through the Shader Playground tool.
  xe-gpu-shader-compiler \
      --shader_input=input_file.bin.vs (or .fs)
      --shader_output=output_file.txt
      --shader_output_type=ucode (or spirvtext)
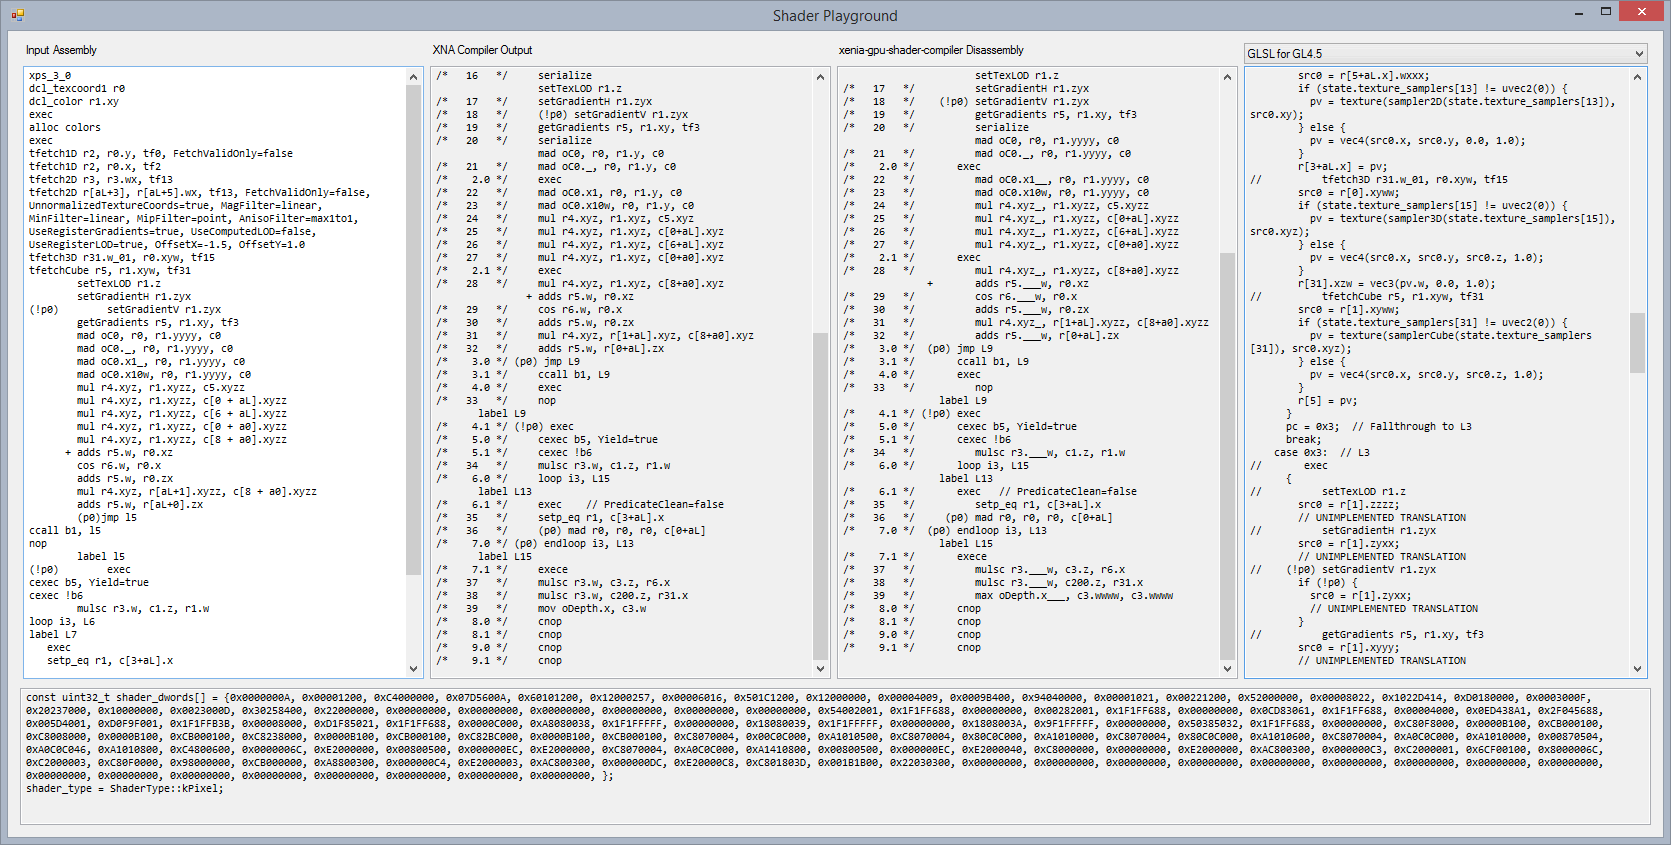
Shader Playground
Built separately (for now) under tools/shader-playground/ is a GUI for interactive shader assembly, disassembly, validation, and translation.
Entering shader microcode on the left will invoke the XNA Game Studio
D3D compiler to translate the ucode to binary. The D3D compiler is then
used to disassemble the binary and display the optimized form. If
xe-gpu-shader-compiler has been built the ucode will be passed to that
for disassembly and that will then be passed through D3D compiler. If
the output of D3D compiler on the xenia disassembly doesn't match the
original D3D compiler output the box will turn red, indicating that the
disassembly is broken. Finally, the right most box will show the
translated shader in the desired format.
For more information and setup instructions see tools/shader-playground/README.md.
xe-gpu-trace-viewer
To quickly iterate on graphical issues, xenia can dump frames (or sequences of frames) while running that can be opened and inspected in a separate app.
The basic workflow is:
- Capture the frame in game (using F4) or a stream of frames.
- Add the file path to the xe-gpu-trace-viewer Debugging command line in Visual Studio.
- Launch xe-gpu-trace-viewer.
- Poke around, find issues, etc.
- Modify code.
- Build and relaunch.
- Goto 4.
Capturing Frames
First, specify a path to capture traces to with
--trace_gpu_prefix=path/file_prefix_. All files will have a randomish name
based on that.
When running xenia.exe you can hit F4 at any time to capture the next frame the game tries to draw (up until a VdSwap call). The file can be used immediately.
Capturing Sequences
Passing --trace_gpu_stream will write all frames rendered to a file, allowing
you to seek through them in the trace viewer. These files will get large.
References
Command Buffer/Registers
Shaders
- LLVM R600 Tables ** The opcode formats don't match, but the name->psuedo code is correct.
- xemit
